
Introduction
In TaroWorks 4.0 mapping functionality became available where you can see records for an object with geolocation data displayed on a Map. You can also click on a specific record within a map to see additional information about that record. The following topics will be covered in this article:
- A. Creating Reports for the Maps tab - In order to view a Report in the Maps tab, the object must have a geolocation field and be saved in the TaroWorks Map folder.
- B. Viewing Reports on the Maps tab - The interaction with the Maps on the maps tab is similar to that of Google Maps.
- C. Printing Maps - While there is currently no specific TaroWorks functionality to print maps, you can use your browser to produce images that you can print or use in documents.
Before you begin:
- Please be advised that Google may require you to register a billing account, but that you can load static maps 100,000 times a month at no cost
- This article is relevant to TaroWorks version 4.0 and above.
- Log in as a System Administrator.
- DO's
- DO make your report in Tabular Format
- DO include a set of geolocation fields(lattitude, longitude) in your Report
- DO include the ID field for the record in your report if you want to a link to the record in the Map
- DO add the formula field that displays a photo if you want the photo to be accessible from the Map
- DO NOT's
- DO NOT add more than one set of geolocation fields
A. Creating Reports for the Maps Tab
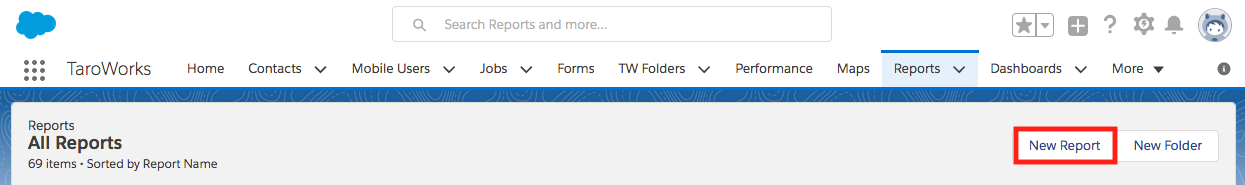
- Click the Reports tab.

- Click New Report.
- Navigate to the Report Type for which you'd like to create a report, and highlight the desired Report Type. Click Create.
Tip: Type the name of the report type or object in the search bar above the menu.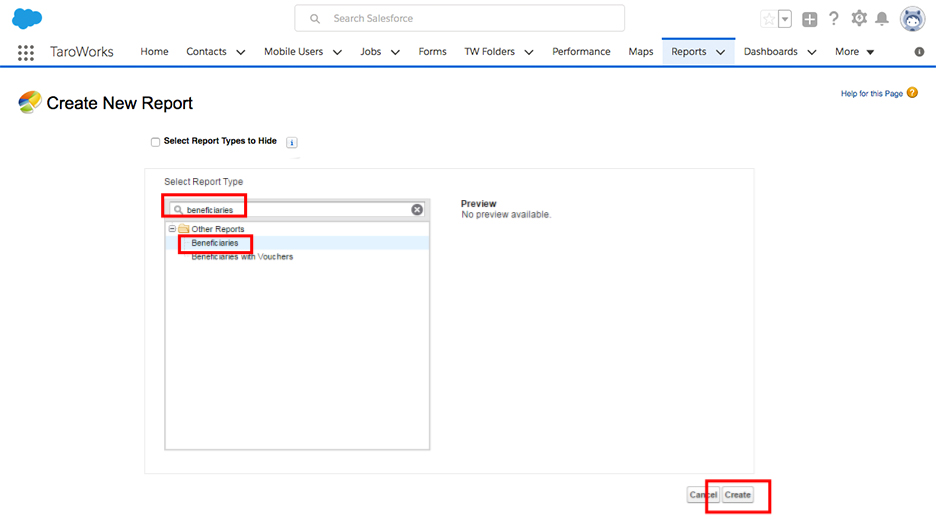
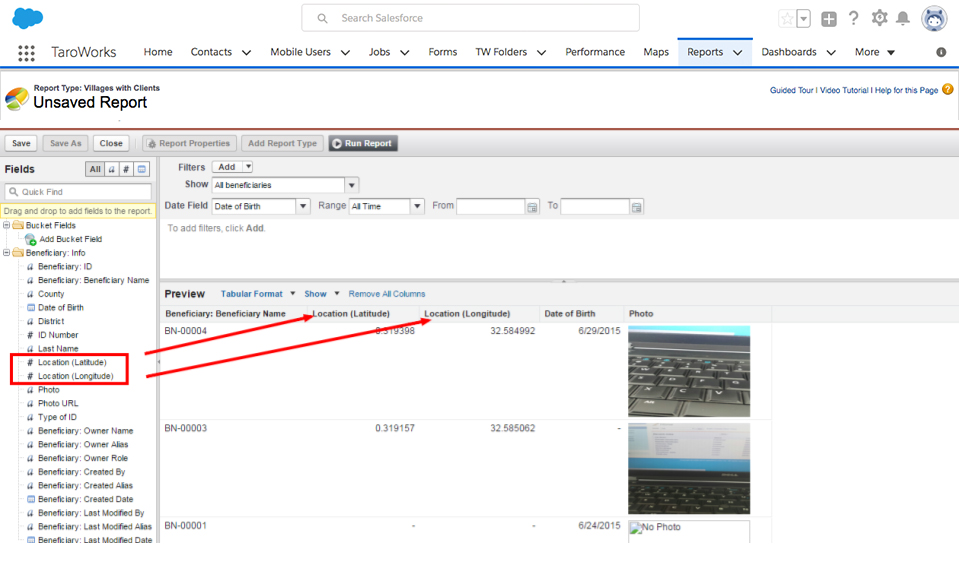
- Select the Tabular Format. Drag the Lattitude and Longitude fields from the available fields on the left and drop them into the report. (The report must have the geolocation fields present in order to be viewed in the Maps tab.). Drag any other information you want to be available when clicking on a record. Add any filters to limit the data you will view on the Map.
- Click Save.
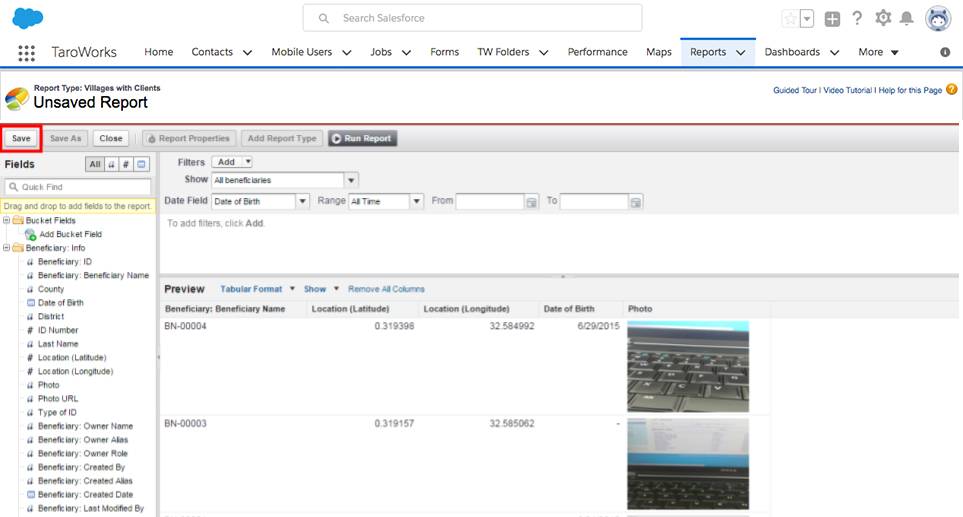
- Enter a Report Name, Description, and select TaroWorks Maps for the Report Folder. Click Save.
- Click Close.
B. Viewing Reports on the Maps Tab
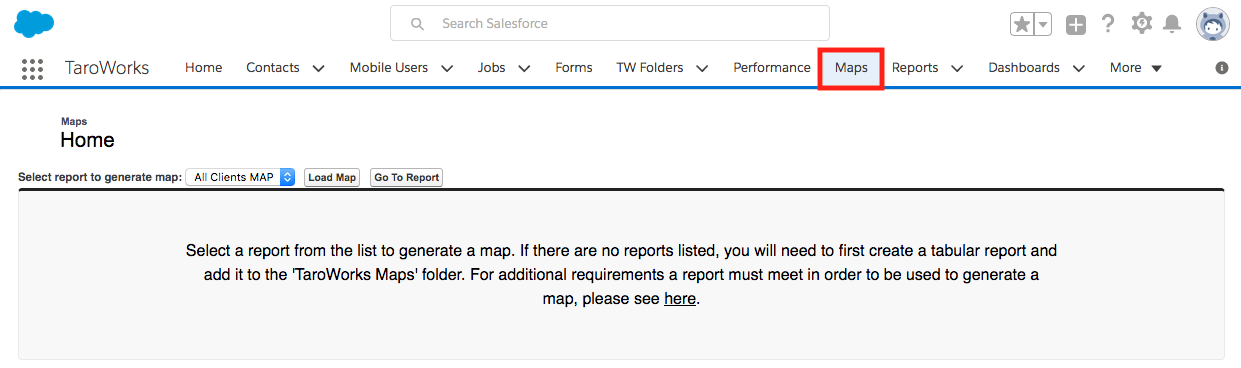
- Click the Maps Tab.
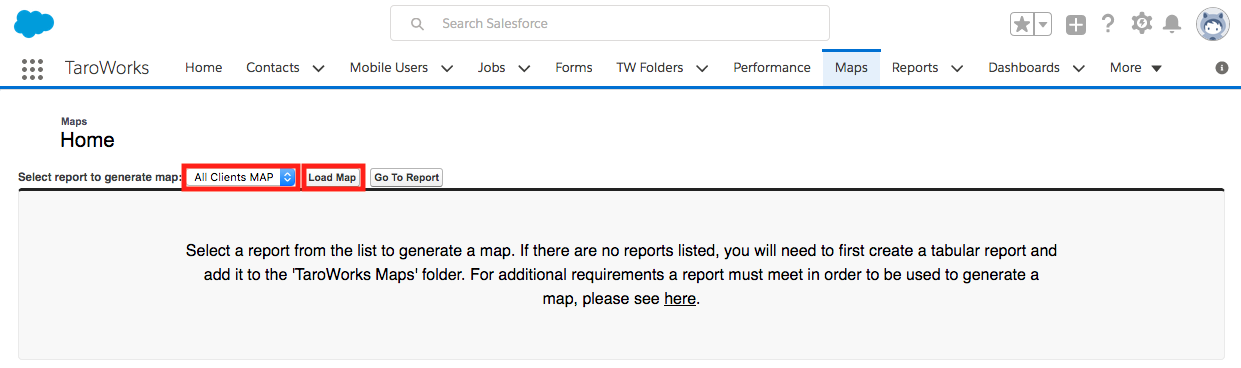
- Select a Report from the drop down menu and click Load Map.
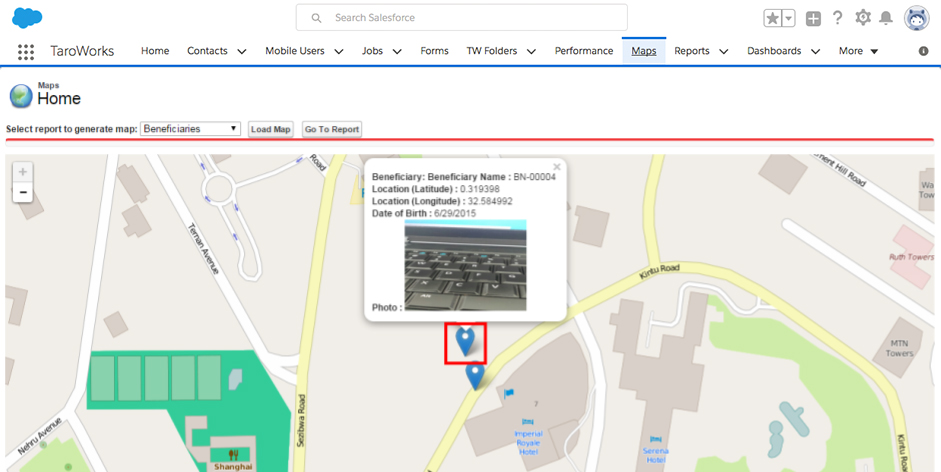
- Click any of the droplets to get more detailed record information.
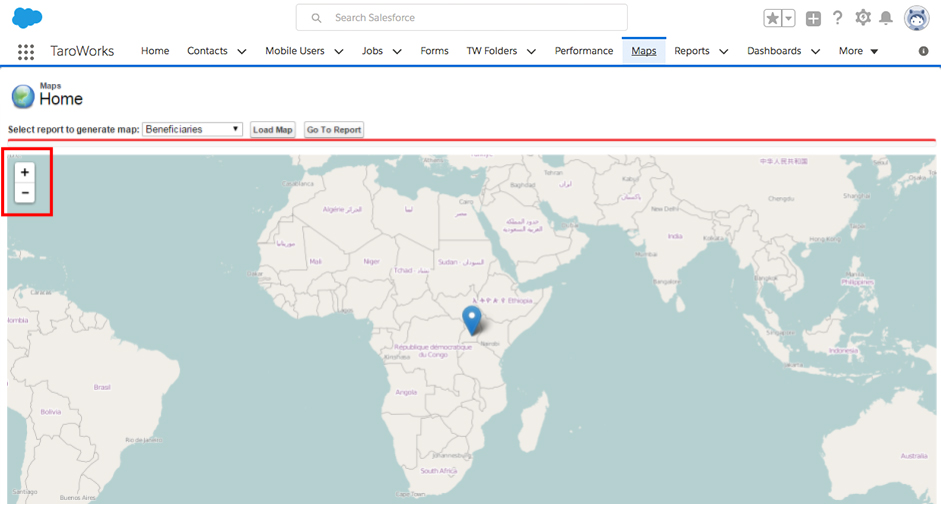
- You can use the + and - buttons on the left to zoom in and out. You can also click and hold down on the map to drag different areas into view.
C. Printing Maps
- Load the Map in the Maps Tab with the data you would like printed in frame.
- Hold down the Ctrl button and enter P (Ctrl+P).
- As the Destination printer, select a printer or "Save As PDF" to generate the map in a file.
- Select the Landscape Layout.
- You can also choose whether to print headers and footers or background graphics.
- Click Save or Print.
- You can also take a screenshot and paste it directly into a word or paint file for editing prior to printing.
Conclusion
Maps are a great way to visualize the geographic data associated with the information you've gathered with TaroWorks. We are continuing to develop this functionality. If you have related needs specific to your organization, feel free to leave a comment below!
Comments
0 comments
Please sign in to leave a comment.